
Plastic packaging (2022)
Production trends and market positioning of a 'transversal' type of packaging. Figures for 2022 on rigid packaging, flexible packaging (excluding laminated films for converting), and plastic accessories.
Barbara Iascone
| 2017 | 2018 | 2019 | 2020 | 2021 | 2022 | 22/21 var % | |
|---|---|---|---|---|---|---|---|
| Production | 2,974 | 3,003 | 3,080 | 3,016 | 2,829 | 2,973 | 5.10% |
| Export | 1,057 | 1,046 | 1,018 | 993 | 1,026 | 973 | -5.10% |
| Import | 594 | 579 | 566 | 572 | 691 | 778 | 12.60% |
| Apparent consumption | 2,511 | 2,536 | 2,628 | 2,595 | 2,494 | 2,777 | 11.30% |
The widespread use of plastic packaging in both the food & beverage and non-food sectors gives it a prominent position in the global packaging industry. Since it is very light, in terms of tonnage it accounts for about 20% of the total, but it accounts for more than 50% when we look at it in terms of turnover.
These percentages also include plastic films intended for lamination and the production of flexible packaging by converters (around 2% in terms of weight and around 6% in terms of turnover).
This analysis looks at rigid packaging, non-laminated flexible packaging (carrier bags, films, protective bubble wrap etc.) and accessories, such as closures, cords, and straps, but does not include flexible converter packaging. Despite coming under numerous attacks on the environmental front and from public opinion, it should not be forgotten that the plastic packaging sector has a proven technological background, which brings with it a propensity for research and innovation. This has made it possible to achieve important milestones both in the fight against food waste and in the production of packaging with recycled plastics or bioplastics.
| Food | 52% |
| Beverage | 22.70% |
| Shopper | 5.80% |
| Chemical products (1) | 5.50% |
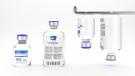
| Cosmetics and pharmaceuticals | 3.60% |
| Other non food (2) | 9.90% |
| Total | 100% |
(1) Lubricants, paints, varnishes and various chemicals.
(2) Electromechanics, textile machinery, electronics, etc.
Positive market trends
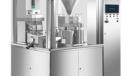
In 2022, this sector recorded a growth rate of +5.1% in terms of production, reaching 2,973 t/000; this confirms a partial recovery of the losses recorded in 2021, when production fell by 6%. The use of recycled plastic continues to grow, expanding the range of products in which it is used. It is worth remembering that plastic packaging falls into three broad categories:
- Rigid packaging: 'blown' containers such as bottles and flasks, thermoformed trays used for food product packaging, jerrycans, pallets and large containers.
- Flexible packaging: carrier bags, plastic bags, protective bubble wrap, etc., shrink wrap for palletising (excluding flexible laminated films for converting).
- Packaging accessories: closures, ropes, strapping, protective chips, etc.
All these types of plastic packaging show a positive trend. If we look at the figures for 2022, we find flexible packaging at 45.7%, up 3.6% compared to 2021. Rigid packaging accounts for 45.2% of the segment (+ 5.6%) while accessories come to 9.1% (+3%).
| Flexible packaging (films, bags and sacks) | 45.70% |
| Rigid packaging (bottles, drums, crates, pallets) | 45.20% |
| Packaging accessories (caps, various closures, bubble films, strapping, foamed chips, slabs, adhesive tapes, etc.) |
9.10% |
| Total | 100.00% |
As far as foreign trade is concerned, there was a strong increase in imports, which have been growing in double figures for two years already: +20.9% in 2021, in addition to +12.6% recorded in 2022. This phenomenon is explained by the massive presence of multinational companies that have gradually shifted their production abroad, where it is cheaper to produce than in Italy.
Exports in 2022 dropped by 5.1%. As for the entire packaging sector, the largest trade flow takes place with European countries, with France and Germany in the lead: in fact, Europe absorbs 89.1% of our exports, while imports from the Old Continent account for 81.6%. Turnover in the sector recorded a growth rate of around +6/7%; this trend is essentially due to the increase in production costs, in relation to raw materials but also, and above all, to energy costs.
According to the first available estimates, the production of bioplastics in Italy is expected to register a growth rate of more than 20% in 2022, settling at around 101,000 tonnes compared to 80,000 tonnes in 2021. In first place, for the use of bioplastics, are carrier bags (62% of the total), followed by ultralight bags used to package loose fruit and vegetables (17.5%). The remaining 20.5% is divided between bags for the collection of organic waste (15%), items for agriculture (3%), catering (disposable tableware), food packaging (tubs) and personal hygiene (2.5% in total).
| Country | Export | Import |
|---|---|---|
| Europe | 89.10% | 81.60% |
| Africa | 3.40% | 6.30% |
| America | 4.20% | 0.70% |
| Asia | 3.00% | 11.30% |
| Oceania | 0.40% | 0.01% |
| World | 100.00% | 100.00% |
Sectors of use
As with paper and cardboard packaging, there are many uses for plastic packaging. Since they can be easily adapted to any requirement, they are widely used in both the food and non-food sectors: the nature and different characteristics of the various polymers mean that they can be used to package both liquids and solids.
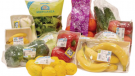
Their greatest use in 2022 was once again in the food sector: 75.2% of plastic packaging was used for food and beverages, 52.5% for the former (up compared to 2021) and 22.7% for the latter, which, however, were lower than the previous year.
The reasons for this trend lie in the shift of the packaging mix in certain user sectors: in recent years, for example, small-format glass and brick packs have eroded the market shares of plastic bottles. A total of 5.5% of plastic packaging is used in the chemical sector and 3.6% for pharmaceuticals and cosmetics. The remaining 15.7% is attributed to the 'other' sector, i.e. a multitude of manufacturing areas such as clothing and accessories or building materials, etc. Also included under 'other' are carrier bags, which alone account for 5.5%.
In the beverage sector, the share of bottles for mineral water packaging is very significant and alone accounts for 16% of the total n-plastic packaging.
Barbara Iascone Istituto Italiano Imballaggio
Recovery and recycling. According to the statistics of COREPLA, the trade consortium that deals with the recovery and recycling of plastic packaging materials under the system put in place by the Italian Packaging Consortium CONAI, around 63% of all plastic packaging that is placed on the market are sent to be recycled and 27% are sent to be used for energy recovery.